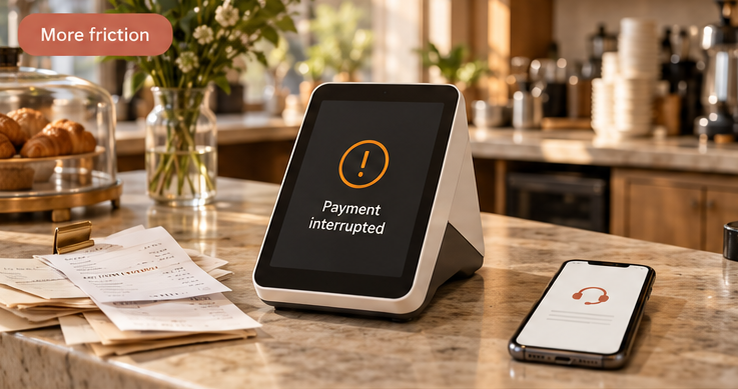
- Processing fees
- Lower quoted cost
- Payment performance
- More interrupted sales
- Operational friction
- More follow-up and manual work
Processing Cost Analysis
Merchant Counselor helps businesses break down payment-processing costs, understand where fees come from and evaluate whether the current setup still makes sense.
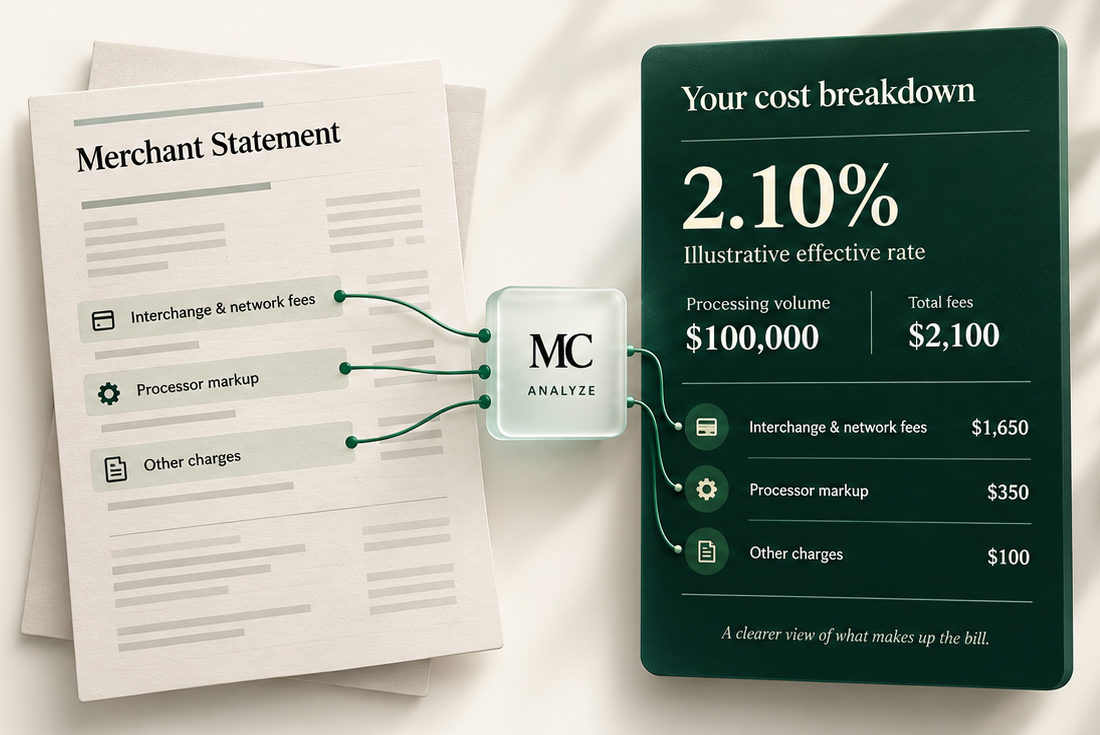
In this illustrative example, a business processes $100,000 and pays $2,100 in total fees — an effective rate of 2.10% ($2,100 ÷ $100,000 = 2.10%).
Illustrative figures only. Actual costs depend on your processor, pricing structure and transaction mix.
Look beyond the quoted rate
Two payment setups can look the same and still cost very different amounts.
0.25%
Gateway markup

$250
Monthly markup cost
Annual difference
Reference
0.50%
Gateway markup

$500
Monthly markup cost
Annual difference
+$3,000 / year
0.65%
Gateway markup

$650
Monthly markup cost
Annual difference
+$4,800 / year
The gateway layer can change the total bill.
Illustrative gateway markups only. Excludes other processing and gateway charges. Actual pricing varies.
Look beyond the effective rate
It shows total fees relative to payment volume. Understanding the cost means looking at what’s inside.
A starting point for the conversation.A closer look for the explanation.

The effective rate is a starting point — not the whole analysis.
Price & performance
Processing fees are only one part of the business impact.
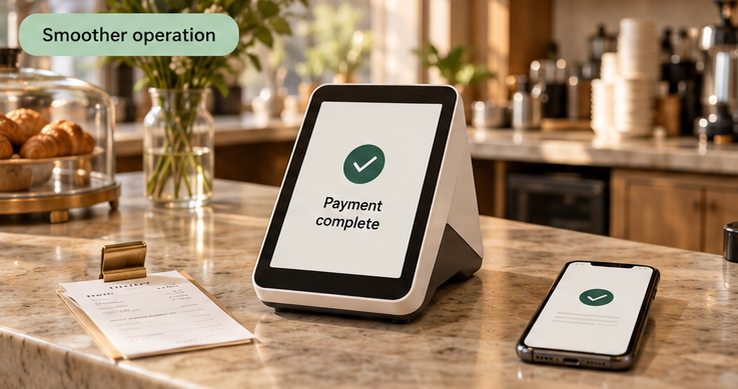
Illustrative scenarios. Actual fees, performance and service vary by provider and setup.
Compare the fee. Then compare the full business impact.
Transaction mix matters
The cards your customers use help explain what you pay.
Illustrative exampleHarbor Bistro • $250,000 monthly volume at each location

Debit-heavy mix
More debit purchases in the mix.
2.05%
Illustrative effective rate

Rewards & business-card-heavy mix
More rewards and business-card purchases.
2.55%
Illustrative effective rate
Similar sales volume can produce different processing costs when the card mix changes.
Look at the cards behind the rate.
Illustrative examples only. Actual costs depend on card mix, network, transaction data and pricing structure.
Commercial Card Payments
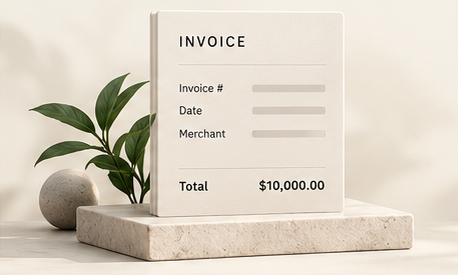
Invoice, tax and line-item details can help eligible transactions qualify for lower interchange categories.
Basic transaction data
2.95% + $0.10
$295.10
Illustrative interchange cost
Reference example
Adds invoice and tax data
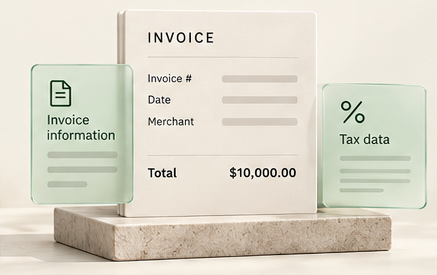
2.50% + $0.10
$250.10
Illustrative interchange cost
$45 less than Standard
Adds line-item detail
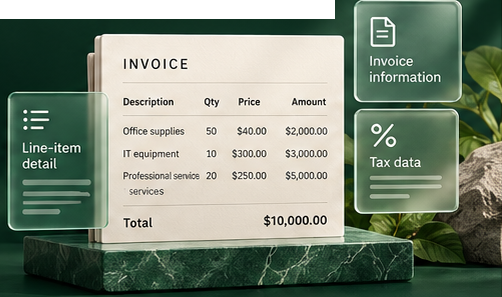
1.90% + $0.10
$190.10
Illustrative interchange cost
$105 less than Standard
The payment stays the same. The data can change the cost.
Illustrative figures, not a current rate quote. Qualification and pricing vary by network, card type, transaction details and gateway or processor capabilities.
Lower interchange qualification or savings are not guaranteed.
Advice that puts your business first
If your pricing is reasonable and your payments are performing well, there may be no reason to switch.
We look for meaningful improvements. When your current setup makes sense, we’ll tell you.
Understand first. Change second.

Your setup checks out. No change recommended. Keep what is working.
Illustrative review outcome, not a real customer result.
We’ll be here when there’s something worth improving.
Illustrative review outcome.
PROPOSAL REVIEW
Bring the fees, technology, terms and service onto the same page.

| Category | Your current setup | The proposed offer |
|---|---|---|
| Fees | ||
| Processor markup | 0.40% + $0.10 | 0.25% + $0.10 |
| Monthly fee | $89 | $49 |
| Gateway | 0.25% + $10/month | 0.50% + $25/month |
| Software | Included | $79/month |
| Technology & commitments | ||
| Equipment | Owned | $1,200 commitment |
| Contract term | Month-to-month | 3 years |
| Funding, support & performance | ||
| Funding | Next business day | 2–3 business days |
| Support | Direct advisor | Call center |
| Payment performance | 92.4% approval rate | Needs verification |
Put both offers on equal footing.
Compare the whole payment environment before deciding.
Illustrative comparison. Actual fees, terms and performance depend on the provider and setup.
Merchant Hub — being built
Merchant Hub is being built to help businesses turn processing statements into a clearer view of volume, fees, effective rate and payment-cost structure.
Explore Merchant Hub →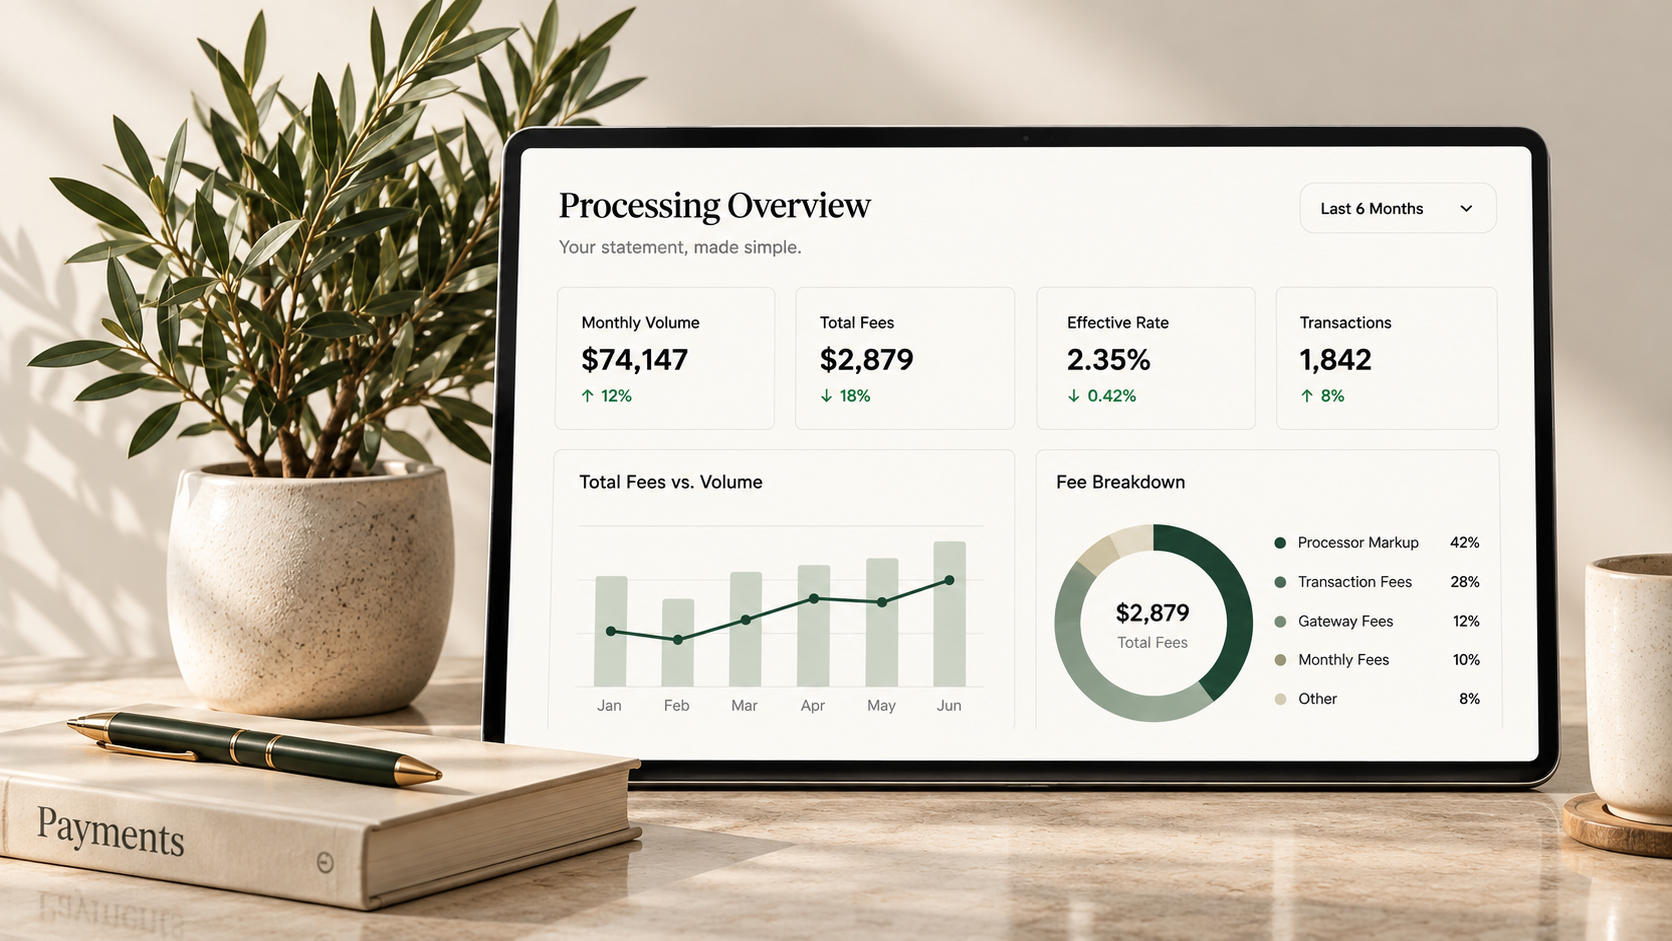

Review processing statements, pricing, transaction mix, software, gateway and other payment-related costs.

Explain where costs originate and identify areas that may deserve adjustment.

Help coordinate pricing changes, provider changes or removal of unnecessary services when appropriate.

Continue monitoring costs and payment performance as volume, transaction mix and technology change.
Start with the statement.
We'll help you understand what you are paying, where the cost comes from and whether anything actually needs to change.
No savings promise. Just a clearer understanding of the numbers.